The Arduino Serial Plotter is a built-in tool in the Arduino IDE that allows you to visualize live data from your Arduino board in real time.
This is particularly useful when working with sensors, analog readings, or debugging data. Unlike the Serial Monitor, which displays raw numerical data, the Serial Plotter provides a graphical representation, making it easier to analyze trends, fluctuations, and patterns.
In this tutorial, we will learn how to graph live sensor data using the Arduino Serial Plotter, covering:
- How the Serial Plotter works
- Graphing single and multiple variables
- Scaling values for better visualization
- Using the Serial Plotter with different types of sensors
By the end of this guide, you’ll be able to create real-time graphs of any data your Arduino collects, whether it’s temperature, humidity, voltage, or any other sensor readings.
Understanding the Arduino Serial Plotter
The Serial Plotter works by reading values sent through Serial.println().
Instead of displaying raw numbers in the Serial Monitor, the Serial Plotter interprets them as y-axis values and plots them in real-time.
Key Features of the Serial Plotter:
- Plots numerical data on a graph over time.
- Automatically adjusts scaling based on incoming values.
- Supports multiple data series for comparison.
- Works with both analog and digital data.
- No extra libraries are needed—just Serial.println().
To open the Serial Plotter:
- Connect your Arduino to the computer.
- Open the Arduino IDE.
- Click on Tools → Serial Plotter.
Now, let’s start plotting data.
Basic example
A basic example is plotting an analog input, such as a potentiometer or a light sensor.
Hardware Setup
We will use a potentiometer connected to A0.
- Middle pin of the potentiometer → A0
- One outer pin → 5V
- Other outer pin → GND

Code for Plotting a Single Variable
void setup() {
    Serial.begin(9600);  // Initialize Serial communication
}

void loop() {
    int sensorValue = analogRead(A0);  // Read the potentiometer value (0-1023)
    Serial.println(sensorValue);       // Send data to Serial Plotter
    delay(50);  // Small delay to slow down the data rate
}
How it Works
- analogRead(A0) reads the potentiometer’s voltage (0-1023).
- Serial.println(sensorValue); sends the value to the Serial Plotter.
- The graph updates in real-time, showing how the potentiometer’s position changes.
You can try turning the potentiometer and watch the values in the graph change.
Multiple Data Streams
The Serial Plotter can graph multiple variables at once, allowing you to compare values side by side.
Example: Plotting Two Sensor Readings
In this example, we’ll plot:
- A potentiometer value on A0
- A light sensor (LDR) on A1
Hardware Setup
- Potentiometer (middle pin to A0, sides to 5V & GND)
- LDR (one side to A1, other to 5V, and a 10kΩ resistor to GND)
arduino and ldr schematic
Code
void setup() {
    Serial.begin(9600);  // Start Serial communication
}

void loop() {
    int potValue = analogRead(A0);  // Read potentiometer
    int ldrValue = analogRead(A1);  // Read light sensor

    Serial.print(potValue);
    Serial.print(" ");  // Separate values with a space
    Serial.println(ldrValue);

    delay(50);
}
How it Works
- Serial.print() sends multiple values separated by spaces.
- Serial.println() moves to the next line, ensuring correct plotting.
- The Serial Plotter detects multiple streams and assigns them different colors.
Turn the potentiometer and shine a light on the LDR—both graphs will update simultaneously.
Scaling Data
By default, the Serial Plotter auto-scales values, but sometimes, scaling manually helps in better readability.
For example, if one value ranges from 0-1023 (potentiometer) and another from 0-5 (a temperature sensor in volts), the smaller values may appear as a flat line.
Solution: Normalize Values
You can scale both values to fit within 0-100 using the map() function.
void setup() {
    Serial.begin(9600);
}

void loop() {
    int potValue = analogRead(A0);
    int tempValue = analogRead(A1);

    int scaledPot = map(potValue, 0, 1023, 0, 100);  // Scale 0-100
    int scaledTemp = map(tempValue, 0, 1023, 0, 100);

    Serial.print(scaledPot);
    Serial.print(" ");
    Serial.println(scaledTemp);

    delay(50);
}
Now, both graphs will have similar ranges, making it easier to compare.
Plotting a Sine Wave : Simulating Data
You can simulate data for testing using a sine wave, which can be useful for debugging.
#include <math.h>

void setup() {
    Serial.begin(9600);
}

void loop() {
    static float x = 0;
    float sineValue = sin(x) * 50 + 50;  // Sine wave scaled to 0-100
    Serial.println(sineValue);

    x += 0.1;
    delay(50);
}
This generates a smooth sine wave on the Serial Plotter, useful for simulating periodic sensor data.
Real-World Example: Plotting Temperature and Humidity
Let’s graph live temperature and humidity readings using a DHT11 sensor.
Hardware Setup
- DHT11 Sensor
- VCC → 5V
- GND → GND
- Data → Digital Pin 4
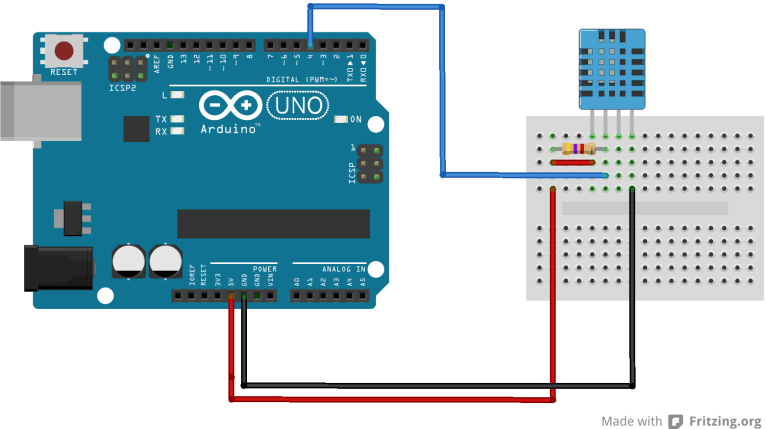
Arduino and DHT11 breadboard
Code for Plotting DHT11 Sensor Data
#include <DHT.h>

#define DHTPIN 4       // DHT11 connected to pin 4
#define DHTTYPE DHT11

DHT dht(DHTPIN, DHTTYPE);

void setup() {
    Serial.begin(9600);
    dht.begin();
}

void loop() {
    float temp = dht.readTemperature();  // Read temperature
    float hum = dht.readHumidity();      // Read humidity

    if (isnan(temp) || isnan(hum)) {
        Serial.println("Error reading sensor!");
        return;
    }

    Serial.print(temp);
    Serial.print(" ");
    Serial.println(hum);

    delay(1000);
}
How It Works
- dht.readTemperature() and dht.readHumidity() collect sensor readings.
- The Serial Plotter displays both graphs in real time.
Conclusion
You have now learned how to graph live data using the Arduino Serial Plotte
This tutorial covered:
Basic single-variable plotting
Multiple-variable visualization
Scaling values for clarity
Simulating sensor data with a sine wave
Real-world sensor plotting (DHT11)
The Serial Plotter is a powerful tool that requires no extra libraries and helps with debugging, analysis, and real-time visualization.
