In this post we take a look at cayenne – https://cayenne.mydevices.com/cayenne/signup
This is the blurb from the website
Easy IoT with myDevices Cayenne
Features Include:
- Remote access your Pi from your mobile phone or computer
- Remote commands (reboot, shutdown, remote access)
- Add sensors, actuators, and extensions and create a custom dashboard with drag and drop widgets
- Monitor data and remote control your devices and projects
- Remote control sensors/actuators with the dashboard GPIO
- Easily set up triggers and actions for your automation projects
I like this site as there are many clear examples for Arduino boards and various ways of connecting, my setup was a an Arduino Uno with an Ethernet Shield fitted to it. I decided to add a BMP180 sensor to the ethernet shield as a test example – there is actually an example for this in the github repo – https://github.com/myDevicesIoT/Cayenne-MQTT-Arduino
Connection
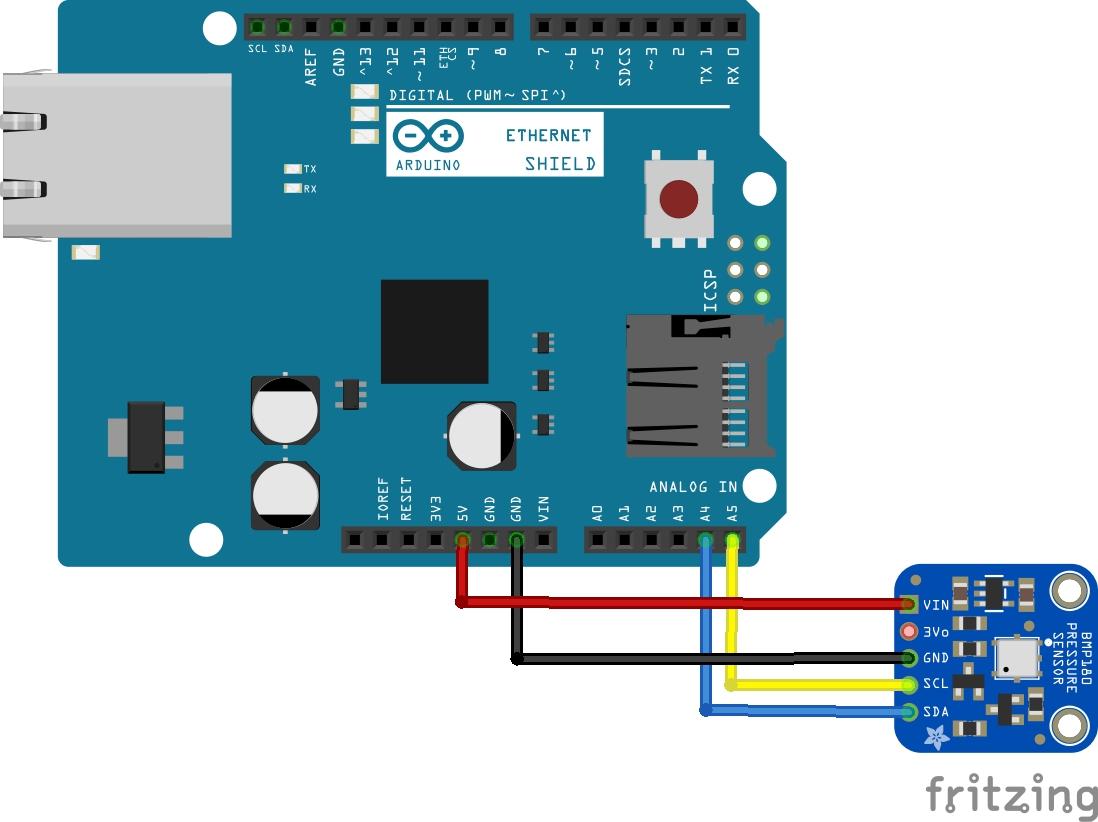
ethernet and bmp180
Code
The default code for the bmp180 is shown, you need to fill in the appropriate details in the authentication section.
This example needs 3 libraries. The Cayenne library, Adafruit BMP085 Unified and Adafruit Sensor library. You can find all of these in the library manager
[codesyntax lang=”cpp”]
#define CAYENNE_PRINT Serial  // Comment this out to disable prints and save space
#include <Wire.h>
#include <Adafruit_Sensor.h>
#include <Adafruit_BMP085_U.h>
#include <CayenneMQTTEthernet.h>

// Cayenne authentication info. This should be obtained from the Cayenne Dashboard.
char username[] = "MQTT_USERNAME";
char password[] = "MQTT_PASSWORD";
char clientID[] = "CLIENT_ID";

#define TEMPERATURE_VIRTUAL_CHANNEL 1
#define BAROMETER_VIRTUAL_CHANNEL 2

Adafruit_BMP085_Unified bmp = Adafruit_BMP085_Unified(10180);
bool bmpSensorDetected = true;

void setup()
{
	Serial.begin(9600);
	Cayenne.begin(username, password, clientID);
	if (!bmp.begin())
	{
		CAYENNE_LOG("No BMP sensor detected");
		bmpSensorDetected = false;
	}
}

void loop()
{
	Cayenne.loop();
}

// This function is called at intervals to send temperature sensor data to Cayenne.
CAYENNE_OUT(TEMPERATURE_VIRTUAL_CHANNEL)
{
	if (bmpSensorDetected)
	{
		float temperature;
		bmp.getTemperature(&temperature);
		// Send the value to Cayenne in Celsius.
		Cayenne.celsiusWrite(TEMPERATURE_VIRTUAL_CHANNEL, temperature);
	}
	else
	{
		CAYENNE_LOG("No BMP sensor detected");
	}
}

// This function is called at intervals to send barometer sensor data to Cayenne.
CAYENNE_OUT(BAROMETER_VIRTUAL_CHANNEL)
{
	if (bmpSensorDetected)
	{
		// Send the command to get data.
		sensors_event_t event;
		bmp.getEvent(&event);

		if (event.pressure)
		{
			// Send the value to Cayenne in hectopascals.
			Cayenne.hectoPascalWrite(BAROMETER_VIRTUAL_CHANNEL, event.pressure);
		}
	}
	else
	{
		CAYENNE_LOG("No BMP sensor detected");
	}
}
[/codesyntax]
Output
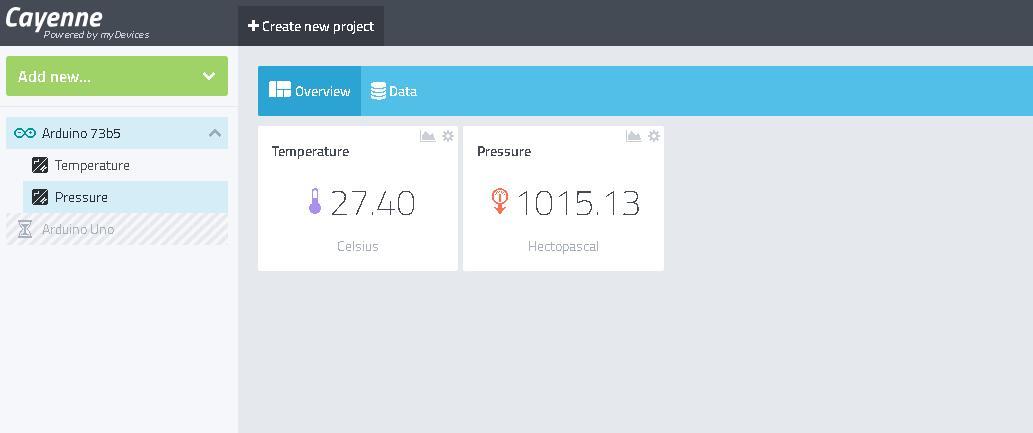
Once connected your dashboard should show some data, I renamed them.
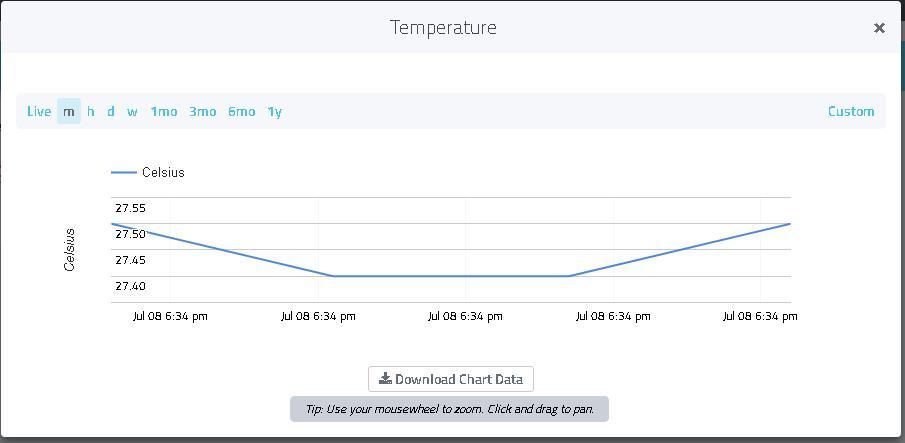
You can see a chart symbol, clicking on that will display a pop up chart of data, here is what my data looked like. You can also download chart data in csv format and as you can see you can show various date filters of data